Data Visualization: Tools for Actionable Insights in Environmental Monitoring
Introduction
In the realm of environmental monitoring, data is abundant but often challenging to interpret. Effective data visualization transforms complex datasets into clear, actionable insights, enabling quicker and more informed decision-making. This blog explores various tools and techniques used in data visualization to enhance environmental monitoring.
Table of Contents
1. Importance of Data Visualization in Environmental Monitoring
2. Key Tools for Data Visualization
- GIS (Geographic Information Systems)
- Dashboard Software
- Data Analytics Platforms
3. Best Practices for Effective Visualization
4. Case Studies and Real-World Applications
5. Future Trends in Data Visualization for Environmental Monitoring
Main Content
Importance of Data Visualization in Environmental Monitoring
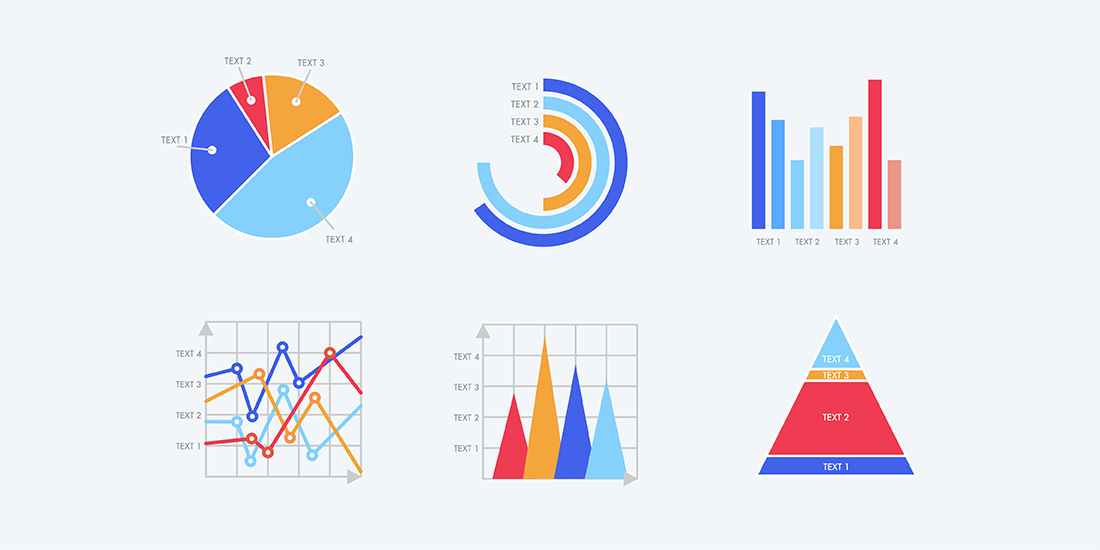
Data visualization is crucial in environmental monitoring as it allows stakeholders to understand vast amounts of data at a glance. By presenting data through graphs, charts, and maps, visualization helps in identifying trends, spotting anomalies, and making data-driven decisions that can impact environmental policies and practices.

"Effective data visualization not only simplifies complex data but also reveals insights that are crucial for timely and informed decision-making."
Key Tools for Data Visualization
GIS (Geographic Information Systems)
Geographic Information Systems (GIS) are powerful tools for visualizing environmental data spatially. GIS integrates various data sources to create detailed maps that can show pollution levels, land use changes, and habitat conditions. This spatial analysis is essential for understanding environmental impacts and planning interventions.

Dashboard Software
Dashboard software like Tableau and Power BI offers dynamic and interactive visualization options. These tools allow users to create customized dashboards that can display real-time data, track key performance indicators, and generate reports. Dashboards are particularly useful for monitoring ongoing environmental metrics and responding to emerging issues.

Data Analytics Platforms
Platforms such as Google Data Studio and D3.js provide advanced data visualization capabilities. They support complex data manipulations and interactive features that can uncover deeper insights from environmental data. These platforms are suitable for detailed analysis and sharing findings with a broad audience.

Best Practices for Effective Visualization
- Clarity: Ensure that visualizations are clear and easy to understand, avoiding clutter.
- Relevance: Choose the appropriate type of visualization for the data being presented.
- Interactivity: Incorporate interactive elements to allow users to explore data in-depth.
- Consistency: Maintain consistency in colors, scales, and labels to avoid confusion.
Case Studies and Real-World Applications
Several environmental monitoring projects have successfully utilized data visualization to drive actionable insights. For example, a study on air quality in urban areas used GIS and dashboard tools to identify pollution hotspots and guide regulatory measures. Similarly, a river monitoring program leveraged interactive data platforms to track water quality changes and inform conservation strategies.

Future Trends in Data Visualization for Environmental Monitoring
The future of data visualization in environmental monitoring will likely include advancements in AI-driven analytics, more sophisticated interactive tools, and greater integration with real-time data sources. These innovations will enhance the ability to predict environmental trends and make more proactive decisions.
Conclusion
Data visualization is an indispensable tool in environmental monitoring, providing clarity and actionable insights from complex datasets. By leveraging tools like GIS, dashboard software, and data analytics platforms, organizations can enhance their monitoring efforts and drive more effective environmental management.